

Tomorrow’s bagel production has to be decided before tomorrow’s demand is known.
Don W. Bradley, a Manhattan Bagel franchise owner in the United States, used to forecast demand with a spreadsheet. Each day, someone had to enter point-of-sale data and waste figures by hand. He later connected ClearCOGS, which draws data from the restaurant’s POS system and predicts how many bagels to make and how many cases of ingredients to order. Bradley says he tightened production and adjusted baking shifts as a result. In March 2026, he reported that labor associated with overproduction fell by about $4,000 a month. This is the owner’s account of the change, not an independently audited result or a promise for other restaurants. The owner’s account
Throwing away a bagel wastes more than flour
Bagel production begins before the sale. Dough must be mixed, fermented, proofed, boiled, and then baked for the day it will be sold. By the time a customer decides what to buy, both ingredients and labor have already been committed.
Bradley’s old spreadsheet used historical moving averages. The method was understandable, but it depended on continued manual maintenance. The busier the store became, the easier it was to skip the data entry that kept the forecast useful.
ClearCOGS connects directly to POS data and combines historical sales with inputs such as weather, local events, and live sales. For Bradley, the useful discovery was not simply a more attractive demand curve. It was that some scheduled work did not need to exist in the first place. Employees were spending time making bagels that would not sell, baking those bagels, and then handling the leftovers. ClearCOGS customer case
The reported $4,000 figure is specifically about labor related to overproduction after production and shift changes. It is not revenue, total savings, or an experimental estimate of what the software alone caused. The exact comparison period, measurement method, and number of stores covered by the owner’s figure are not public.
Sell a prep sheet, not a demand curve
A cash register records what sold yesterday. A kitchen needs to know what to make today, at what time, and in what quantity.
ClearCOGS translates its forecast into item- and time-specific prep sheets for managers before opening. Purchasing receives suggested order quantities organized by delivery date. Labor planning can compare expected demand with the schedule instead of copying the same staffing pattern from the previous week. Official product workflow
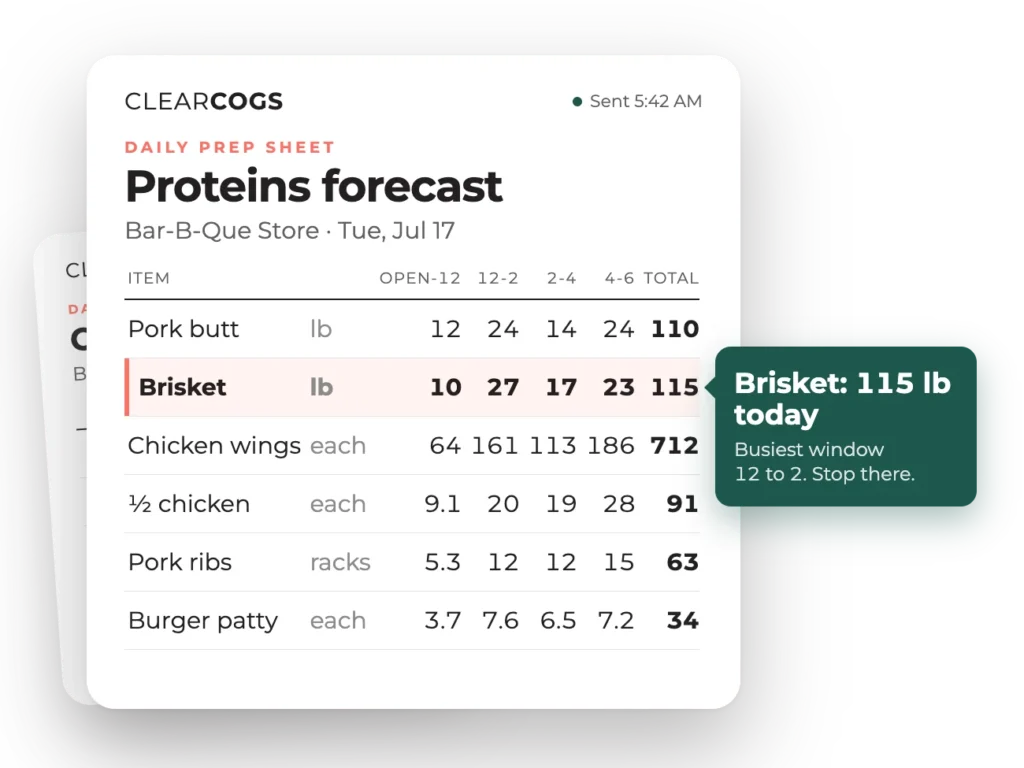
ClearCOGS presents the forecast as quantities to prepare at different kitchen stations and times. The image is an official product example, not Bradley’s store record.
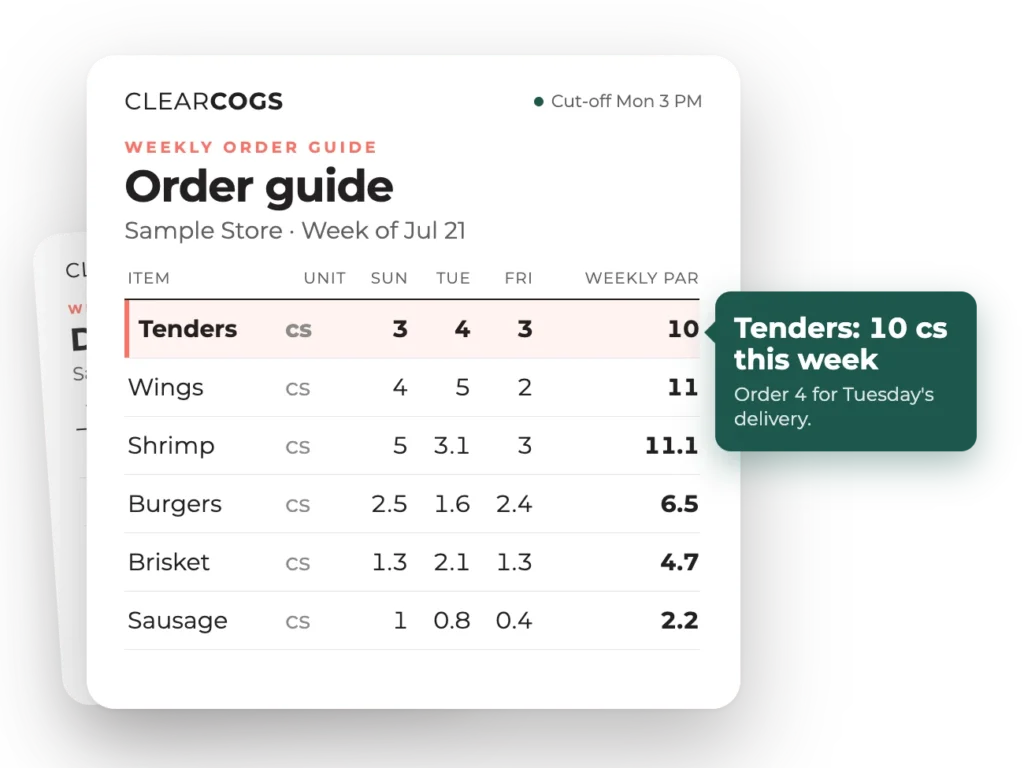
The ordering view expresses the recommendation in delivery dates and cases. It is an official example rather than evidence of a customer’s financial result.
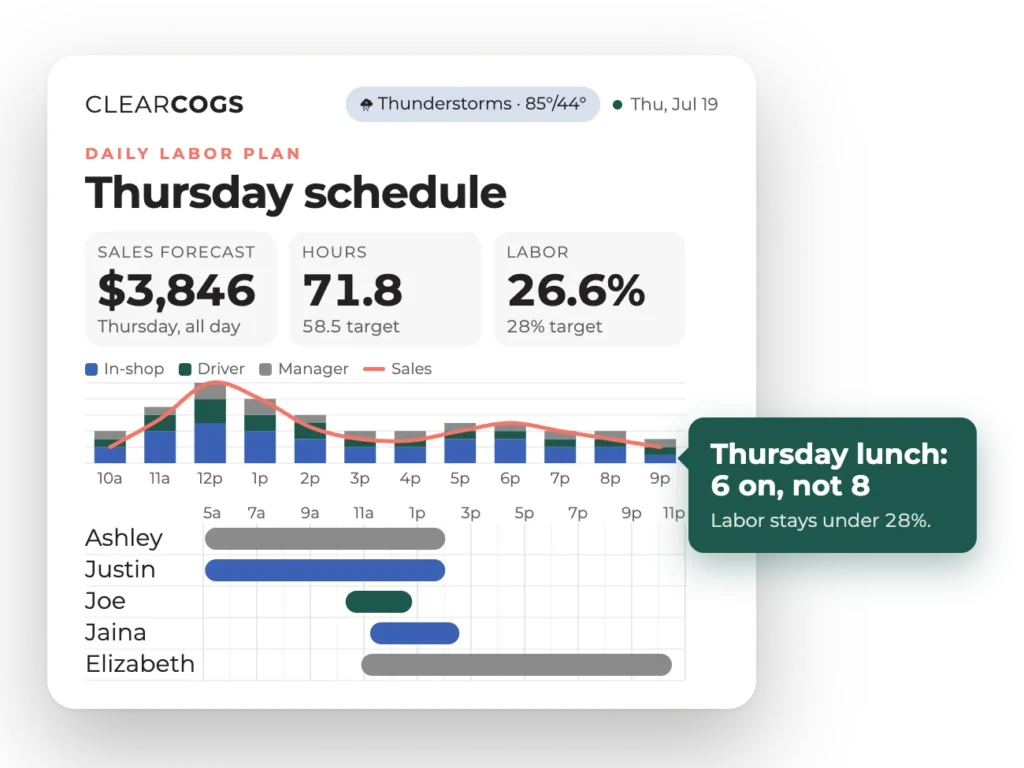
The labor view places expected sales beside staffing. The demonstration numbers should not be read as Bradley’s schedule.
The same forecast must become a different unit for each role. A cook needs portions. A buyer needs cases. A manager needs labor hours. If the manager still has to copy a prediction into three separate spreadsheets, the software has merely moved the maintenance work to another place.
This translation is where a forecasting model becomes an operating product. Accuracy matters, but a restaurant cannot act on an accuracy score by itself. It can act on a prep quantity before a shift begins, an order quantity before a supplier cutoff, or a staffing change before the schedule is final.
Why the subscription is priced per location
ClearCOGS publishes a standard price of $150 per location per month, with possible volume pricing for groups of 15 or more locations. The subscription includes prep reports tailored to kitchen stations and time periods rather than only one demand number for headquarters. Official pricing
That billing unit matches the unit of delivery. A restaurant group may buy a consistent forecasting method, but the actual reduction in prep, the ingredient order, and the shift adjustment happen at each store. A location with a different menu, demand pattern, opening schedule, or local event calendar needs its own operational output.
The public $150 price is not necessarily Bradley’s contract price. Likewise, his reported $4,000 monthly labor change should not be inserted directly into another store’s return-on-investment model. Different restaurants have different waste baselines, labor costs, production lead times, and ability to change schedules.
The most useful way to evaluate a product like this is not to begin with whether its model improved a forecasting metric by a few percentage points. Put yesterday’s prep sheet next to today’s production record and staffing plan. Can the manager identify a batch that was not made, a case that was not ordered, or a period of labor that did not need to be scheduled? That is the point at which a prediction becomes an operating result.